
Understanding the internal behaviour of batteries is essential for improving performance, safety, and lifetime. With the latest update of BatReg2, ELS Instruments introduces a powerful new feature: Electrochemical Impedance Spectroscopy (EIS) for battery characterization.
This new capability allows engineers and researchers to analyze battery impedance in the frequency domain, providing valuable insight into electrochemical processes, internal resistance, and dynamic response.
Data Visualization: Nyquist Plot and Frequency Response
The new feature provides two complementary ways to visualize impedance spectroscopy results.
The first is the Nyquist Plot, one of the most common representations used in electrochemical analysis. In this graph the X-axis represents the real part of the impedance (Re(Z)) while the Y-axis represents the imaginary part of the impedance (−Im(Z)). Each point of the curve corresponds to a measurement at a specific excitation frequency. The resulting shape provides important information about the internal electrochemical processes occurring in the battery.
The second visualization mode is the Frequency Response Plot, commonly used in the electronics, where impedance, magnitude and phase, is displayed as a function of frequency.
These two visualization methods allow users to explore the impedance behaviour of the battery from different perspectives and better interpret the electrochemical dynamics of the cell.
Example: EIS Measurement on a 21700 Battery Cell
The image below shows the BatReg2 Graphical User Interface (GUI) displaying the results of an EIS measurement performed on a type 21700, 3.6-V, 4-Ah Li-ion battery cell.
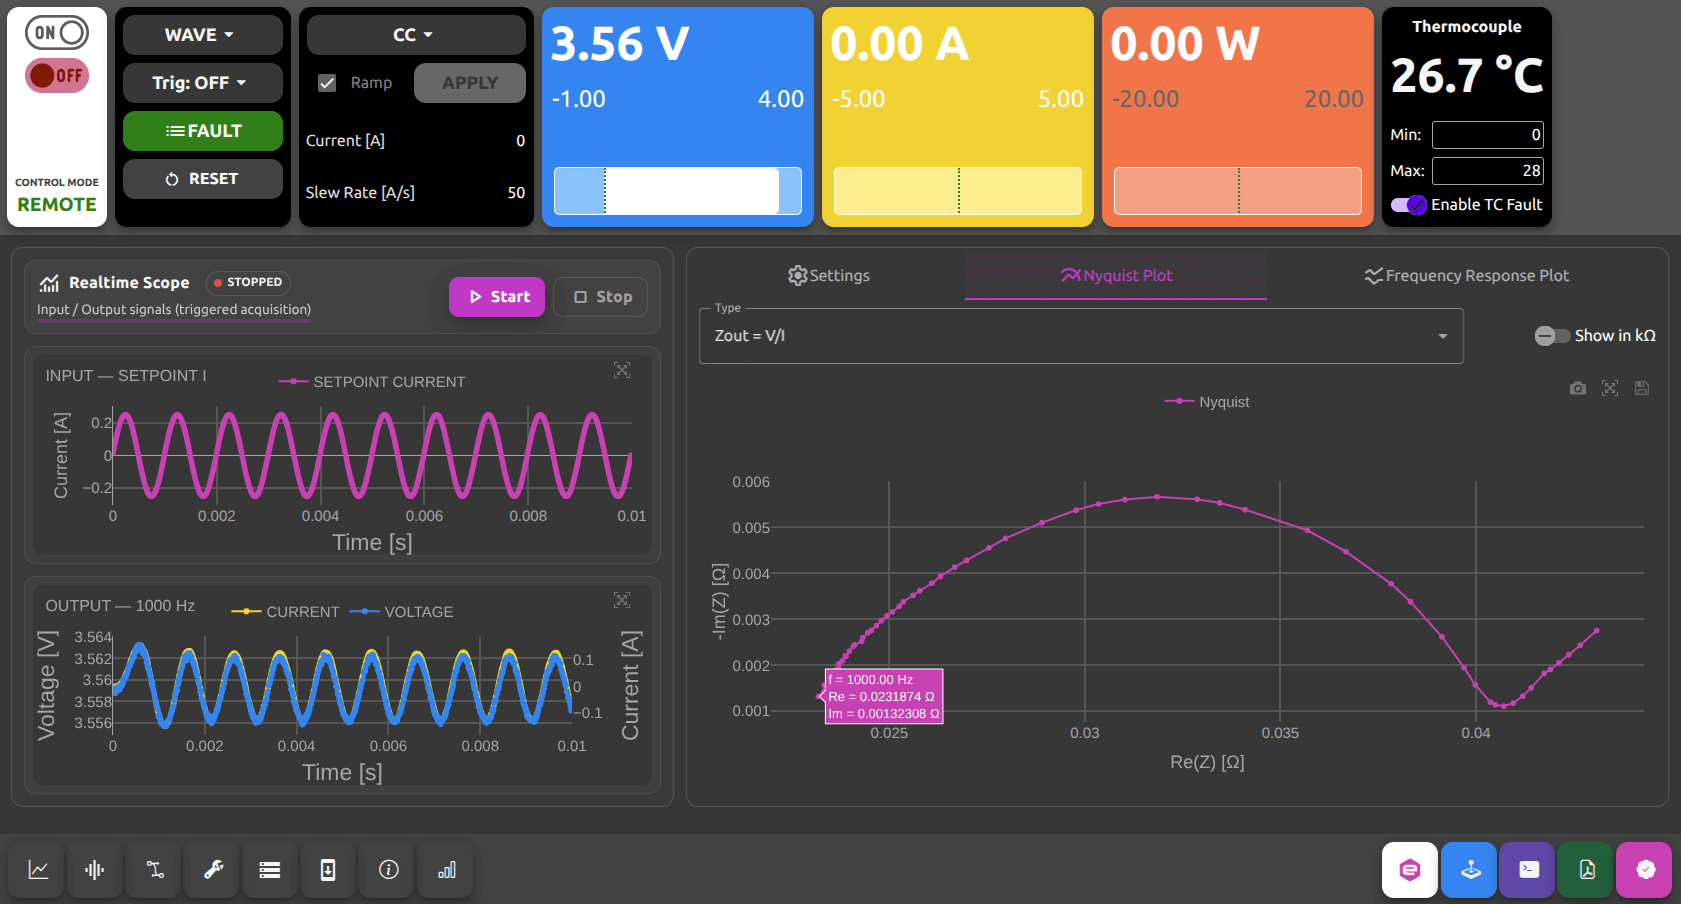
The interface provides:
• Full access to excitation waveform settings (i.e. CC/CV, waveform periods, amplitude, etc.);
• Real-time visualization of excitation signals (current and voltage in time);
• Nyquist and Frequency Response plots.
A Powerful Tool for Battery Research and Testing
The integration of Electrochemical Impedance Spectroscopy into the BatReg2 significantly expands the capabilities of the platform for battery testing and research.
With this new feature, BatReg2 now combines the functionality of a battery cycler and an EIS measurement instrument in a single system. This integration allows users to perform traditional battery cycling tests and advanced impedance spectroscopy measurements within the same platform, without the need for additional equipment.
Having both capabilities in one product simplifies laboratory setups, improves measurement efficiency, and enables deeper battery analysis throughout the entire testing workflow.
With the BatReg2, researchers and engineers can seamlessly move from battery cycling and performance testing to advanced electrochemical impedance analysis, making it a powerful and versatile tool for battery research, development, and quality control.
More Information
Visit the Battery Testers and Cyclers page to find out more!